The accounts, as they look in the platform.

20 screenshots from Shopify, WooCommerce and Meta Ads Manager, dated January 2026 to September 2026.

Every exhibit has a fixed number that is never reused, and only its platform and period are written under it. Brand, store and ad names are cropped. A screenshot without a visible period is not published.

17 exhibits

  • Ex. 21September 2026 · Shopify Analytics · Egypt

    Exhibit 21

    Shopify Analytics
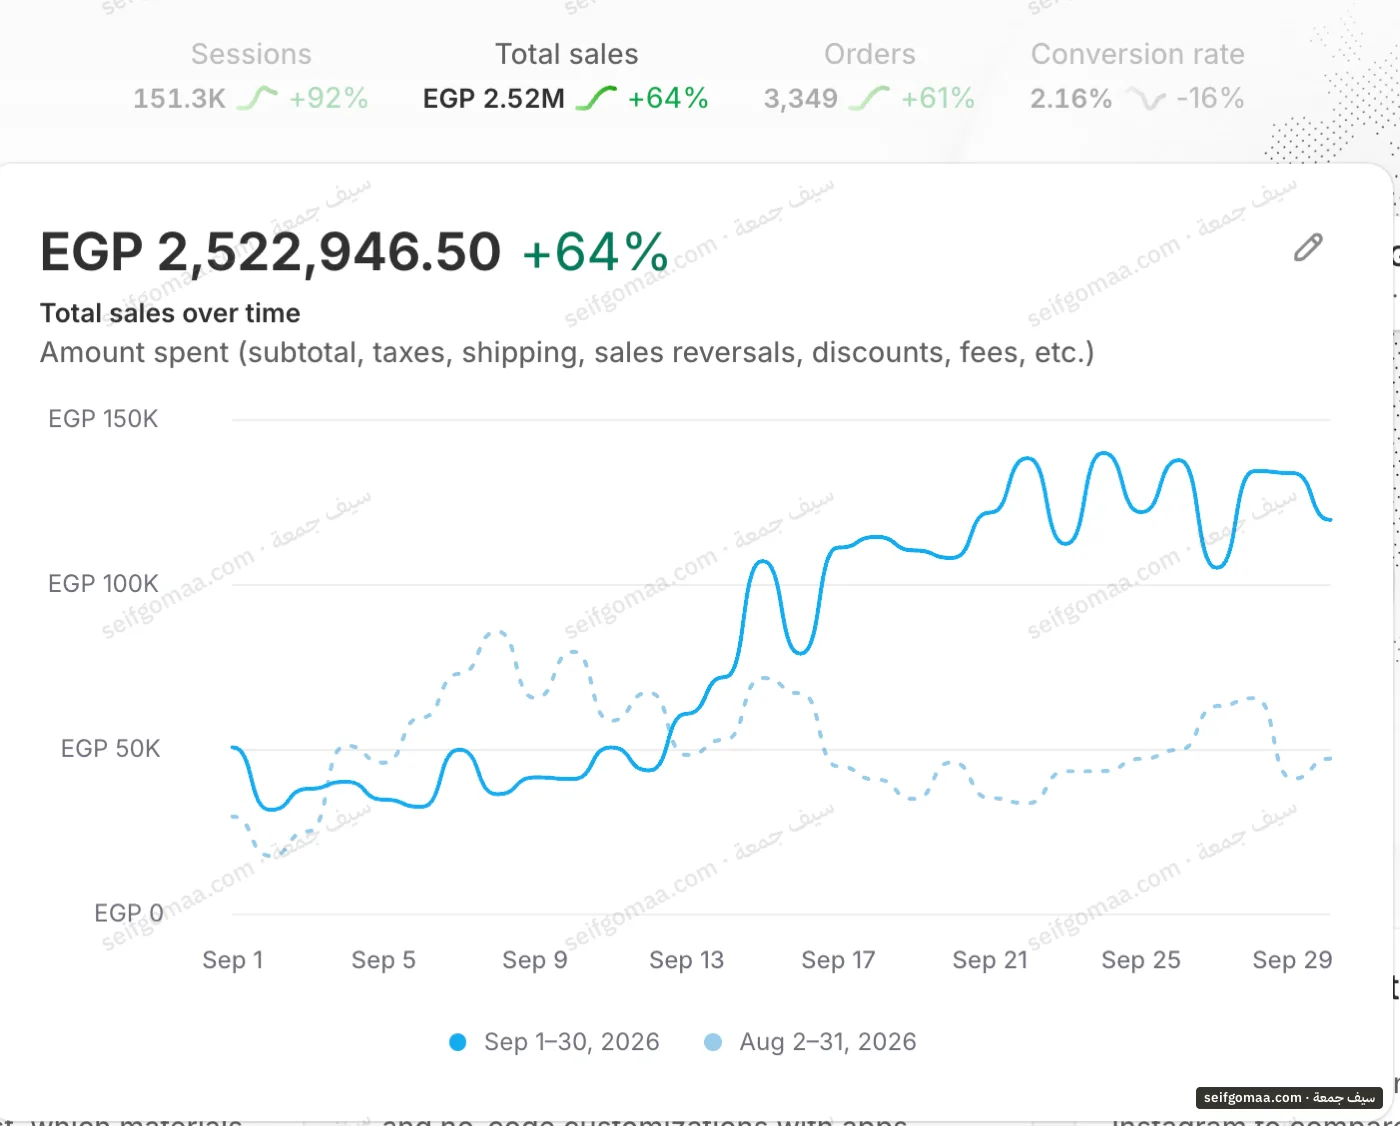
    Shopify Analytics screenshot, September 2026, showing sales, period change, orders, conversion rate on an account run by Seif Gomaa. Brand names cropped.

    Shopify Analytics for an account in Egypt, September 2026. It shows sales, period change, orders, conversion rate. The figures are in the screenshot only.
    Shopify Analytics · September 2026
  • Ex. 201 January 2026 to early October 2026 · Meta Ads Manager · Egypt

    Exhibit 20

    Meta Ads Manager
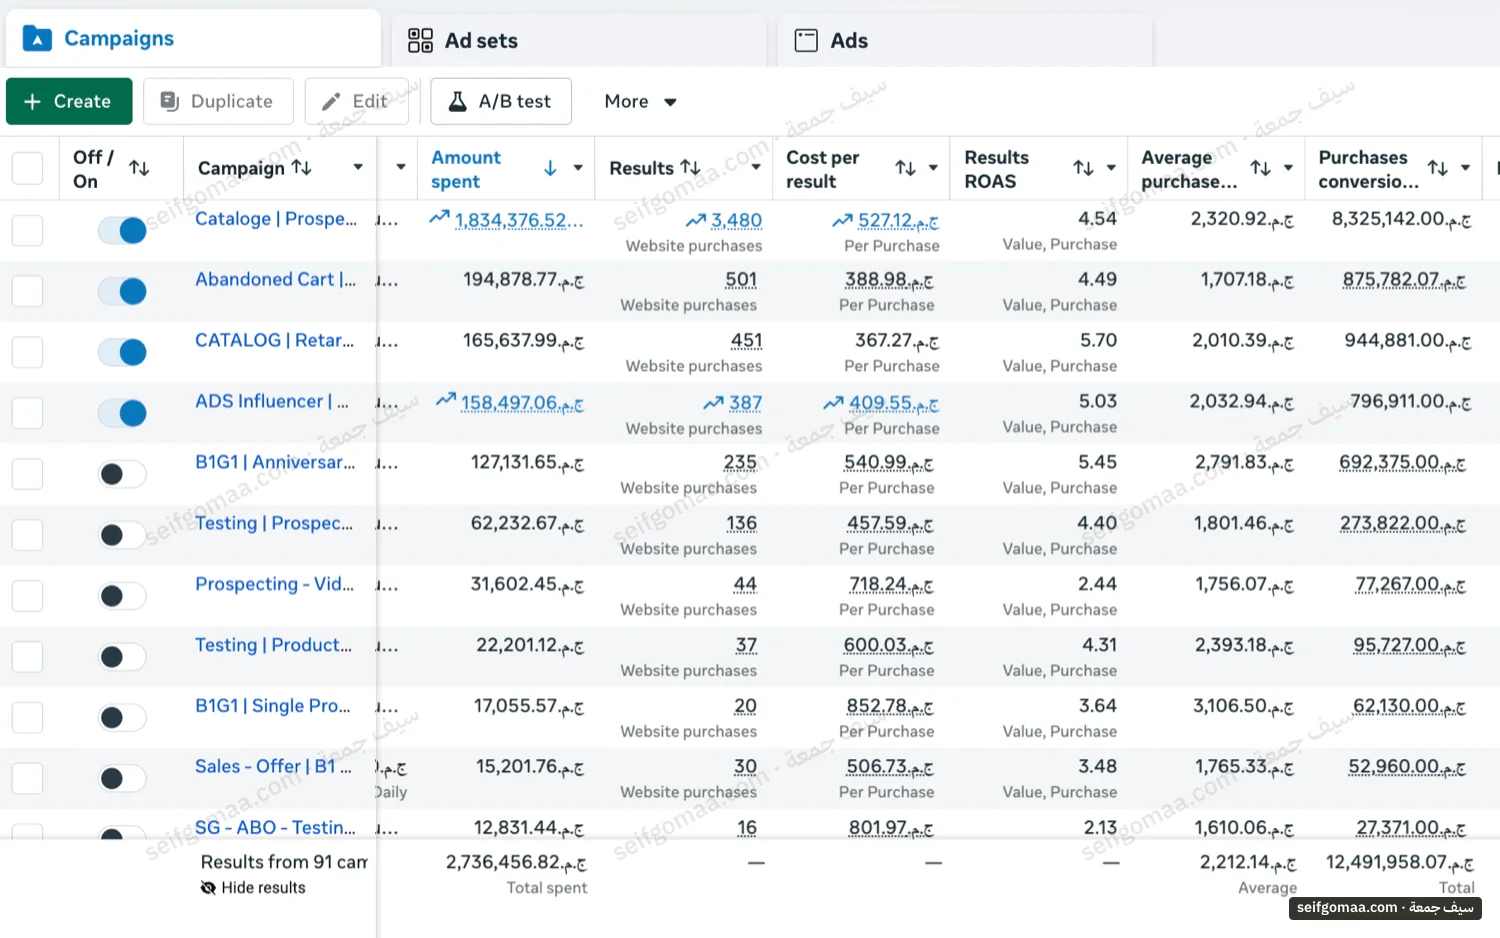
    Meta Ads Manager screenshot, 1 January 2026 to early October 2026, showing purchase value, ROAS, ad spend on an account run by Seif Gomaa. Brand names cropped.

    Meta Ads Manager campaign view for an account in Egypt, covering 1 January 2026 to early October 2026. It shows purchase value, ROAS and ad spend for the year so far. The period was checked against the Meta API on 4 October 2026.
    Meta Ads Manager · 1 January 2026 to early October 2026
  • Ex. 17August 2026 · Shopify Analytics · Egypt

    Exhibit 17

    Shopify Analytics
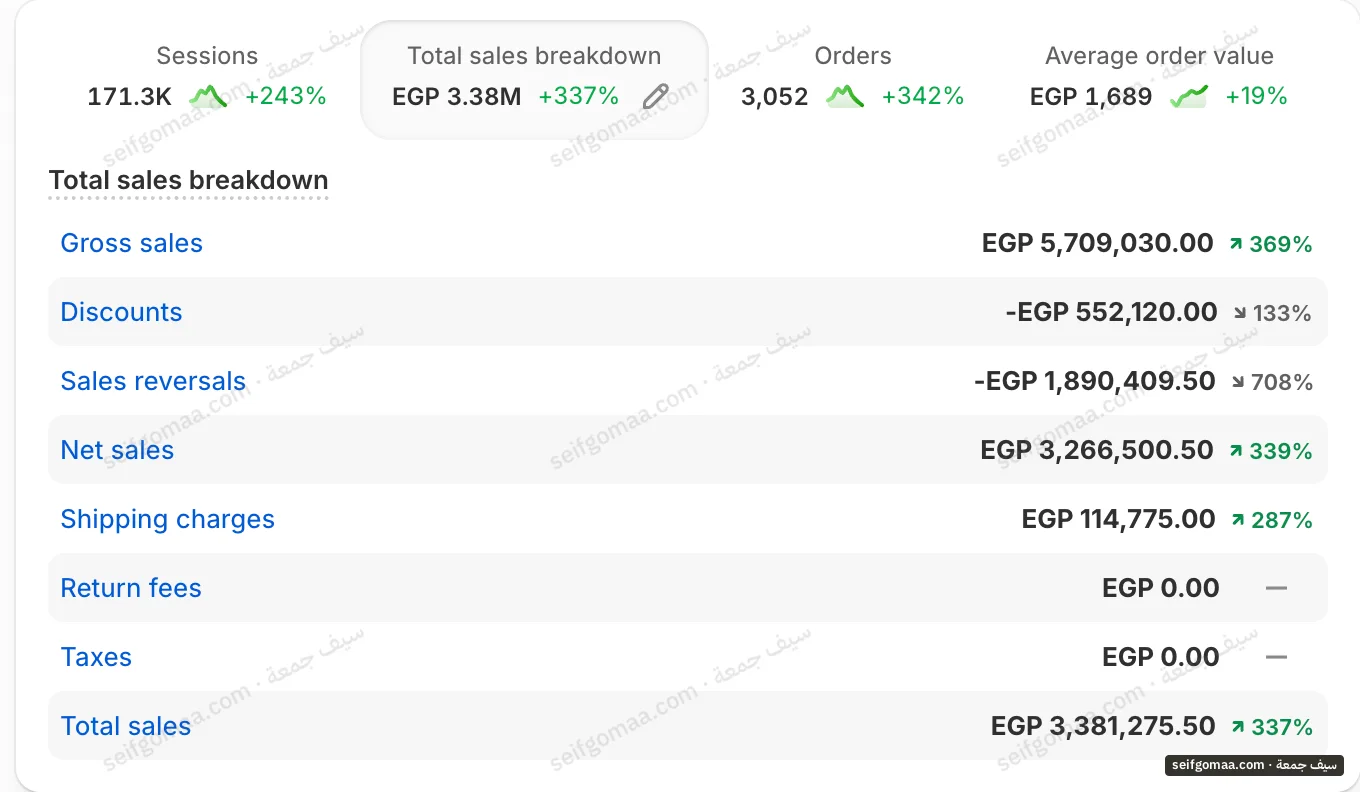
    Shopify Analytics screenshot, August 2026, showing sales, orders, average order value on an account run by Seif Gomaa. Brand names cropped.

    Shopify Analytics for an account in Egypt, August 2026. It shows sales, orders, average order value. The figures are in the screenshot only.
    Shopify Analytics · August 2026
  • Ex. 161 January 2026 to 31 March 2026 · Shopify Analytics · Egypt

    Exhibit 16

    Shopify Analytics
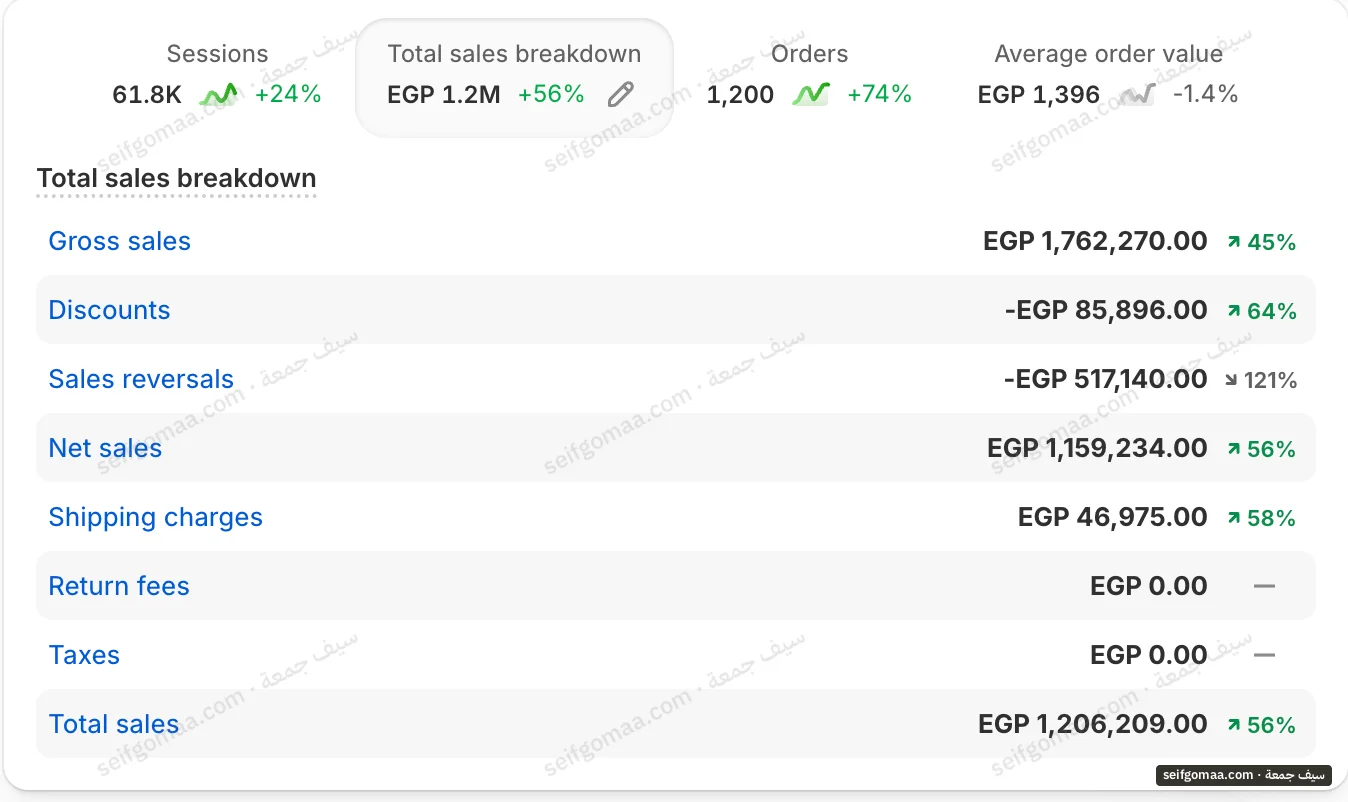
    Shopify Analytics screenshot, 1 January 2026 to 31 March 2026, showing sales, period change, orders, average order value on an account run by Seif Gomaa. Brand names cropped.

    Shopify Analytics for a fashion store in Egypt, 1 January to 31 March 2026, with the period read off the store's own date picker. It shows sales, orders, average order value and the change against the period before.
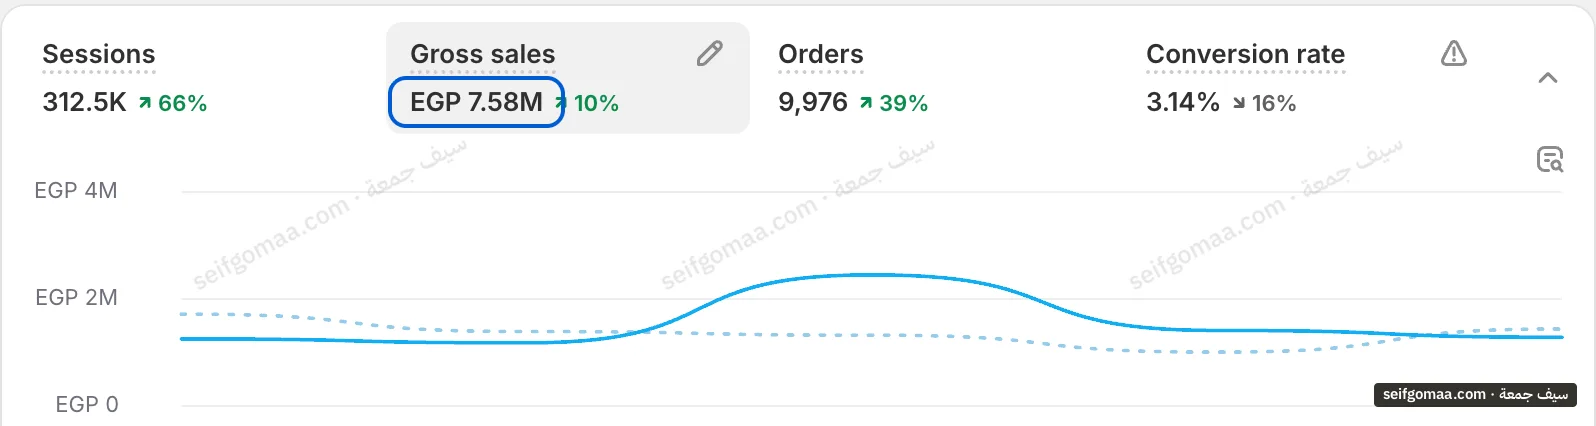
    Shopify Analytics · 1 January 2026 to 31 March 2026
  • Ex. 15Last 90 days, as shown · Shopify Analytics · Egypt

    Exhibit 15

    Shopify Analytics
    Shopify Analytics screenshot, Last 90 days, as shown, showing sales, orders, conversion rate on an account run by Seif Gomaa. Brand names cropped.

    Shopify Analytics for an account in Egypt, Last 90 days, as shown. It shows sales, orders, conversion rate. The figures are in the screenshot only.
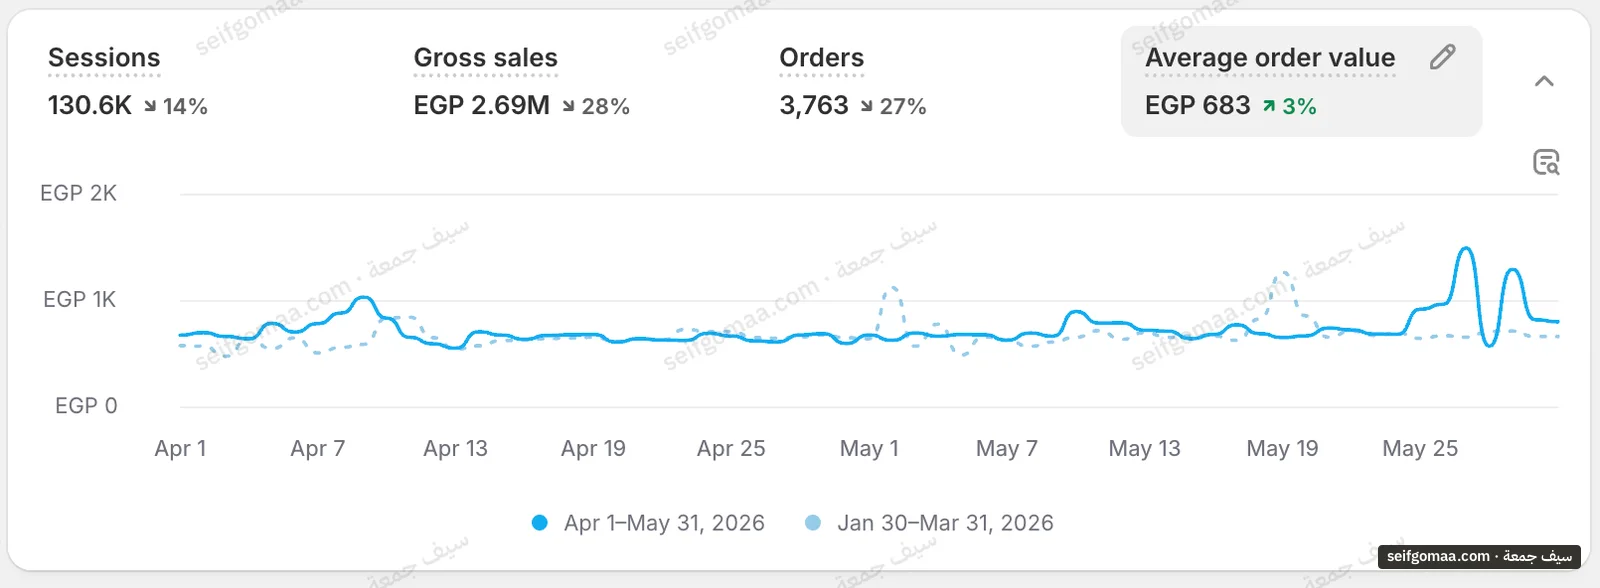
    Shopify Analytics · Last 90 days, as shown
  • Ex. 141 April 2026 to 31 May 2026 · Shopify Analytics · Egypt

    Exhibit 14

    Shopify Analytics
    Shopify Analytics screenshot, 1 April 2026 to 31 May 2026, showing sales, orders, average order value on an account run by Seif Gomaa. Brand names cropped.

    Shopify Analytics for an account in Egypt, 1 April 2026 to 31 May 2026. It shows sales, orders, average order value. The figures are in the screenshot only.
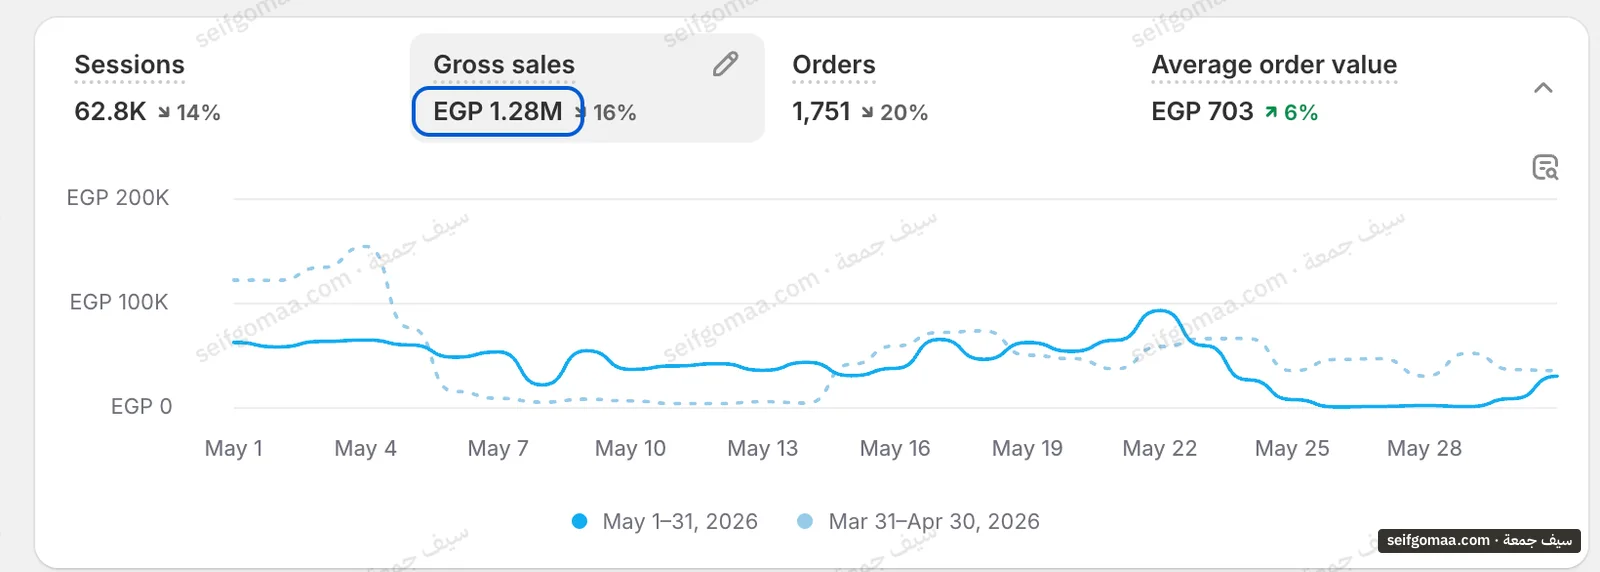
    Shopify Analytics · 1 April 2026 to 31 May 2026
  • Ex. 13May 2026 · Shopify Analytics · Egypt

    Exhibit 13

    Shopify Analytics
    Shopify Analytics screenshot, May 2026, showing sales, orders, average order value on an account run by Seif Gomaa. Brand names cropped.

    Shopify Analytics for an account in Egypt, May 2026. It shows sales, orders, average order value. The figures are in the screenshot only.
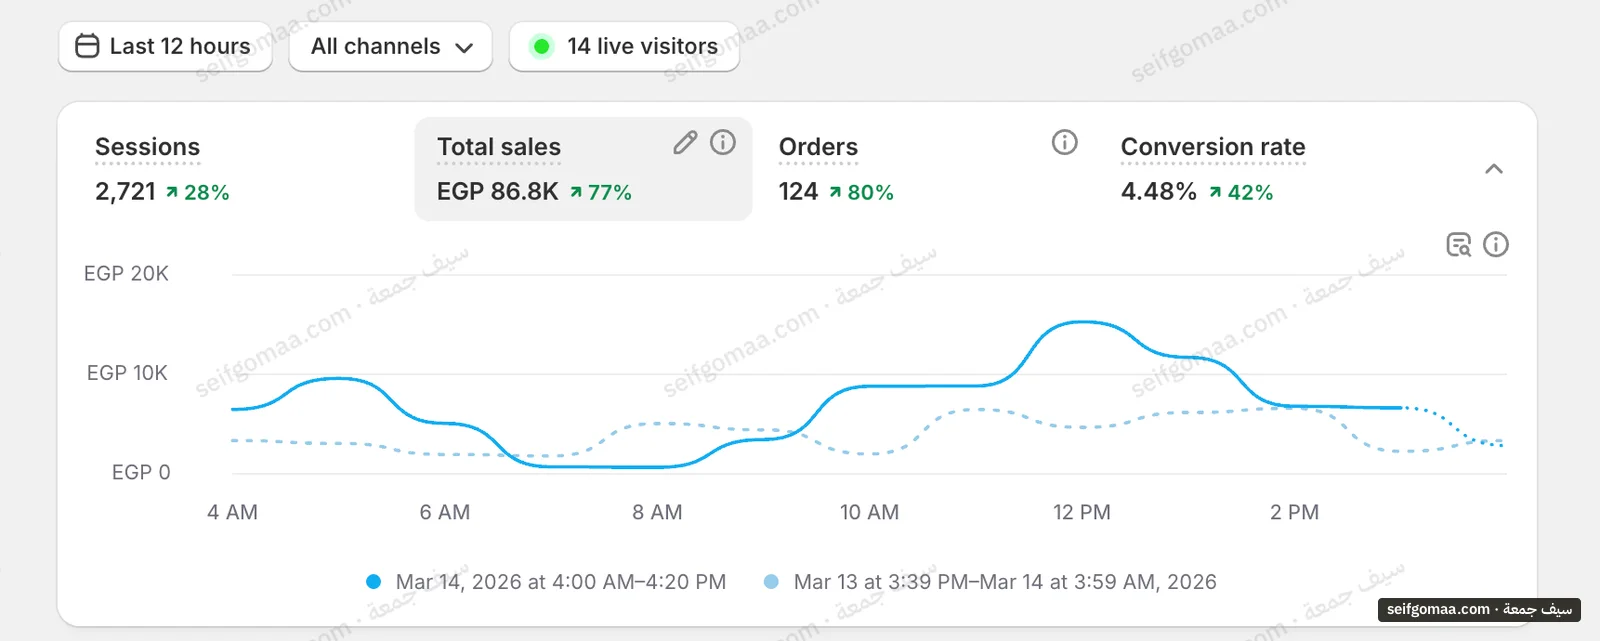
    Shopify Analytics · May 2026
  • Ex. 1112 hours, as shown · Shopify Analytics · Egypt

    Exhibit 11

    Shopify Analytics
    Shopify Analytics screenshot, 12 hours, as shown, showing sales, orders, conversion rate on an account run by Seif Gomaa. Brand names cropped.

    Shopify Analytics for an account in Egypt, 12 hours, as shown. It shows sales, orders, conversion rate. The figures are in the screenshot only.
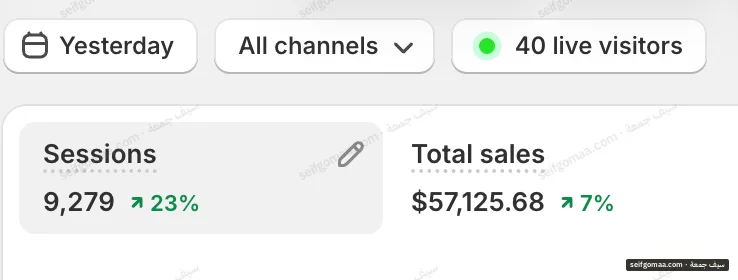
    Shopify Analytics · 12 hours, as shown
  • Ex. 9One day (“yesterday” on the screenshot) · Shopify Analytics

    Exhibit 9

    Shopify Analytics
    Shopify Analytics screenshot, One day (“yesterday” on the screenshot), showing sales, sessions, period change on an account run by Seif Gomaa. Brand names cropped.

    Shopify Analytics, One day (“yesterday” on the screenshot). It shows sales, sessions, period change. The figures are in the screenshot only.
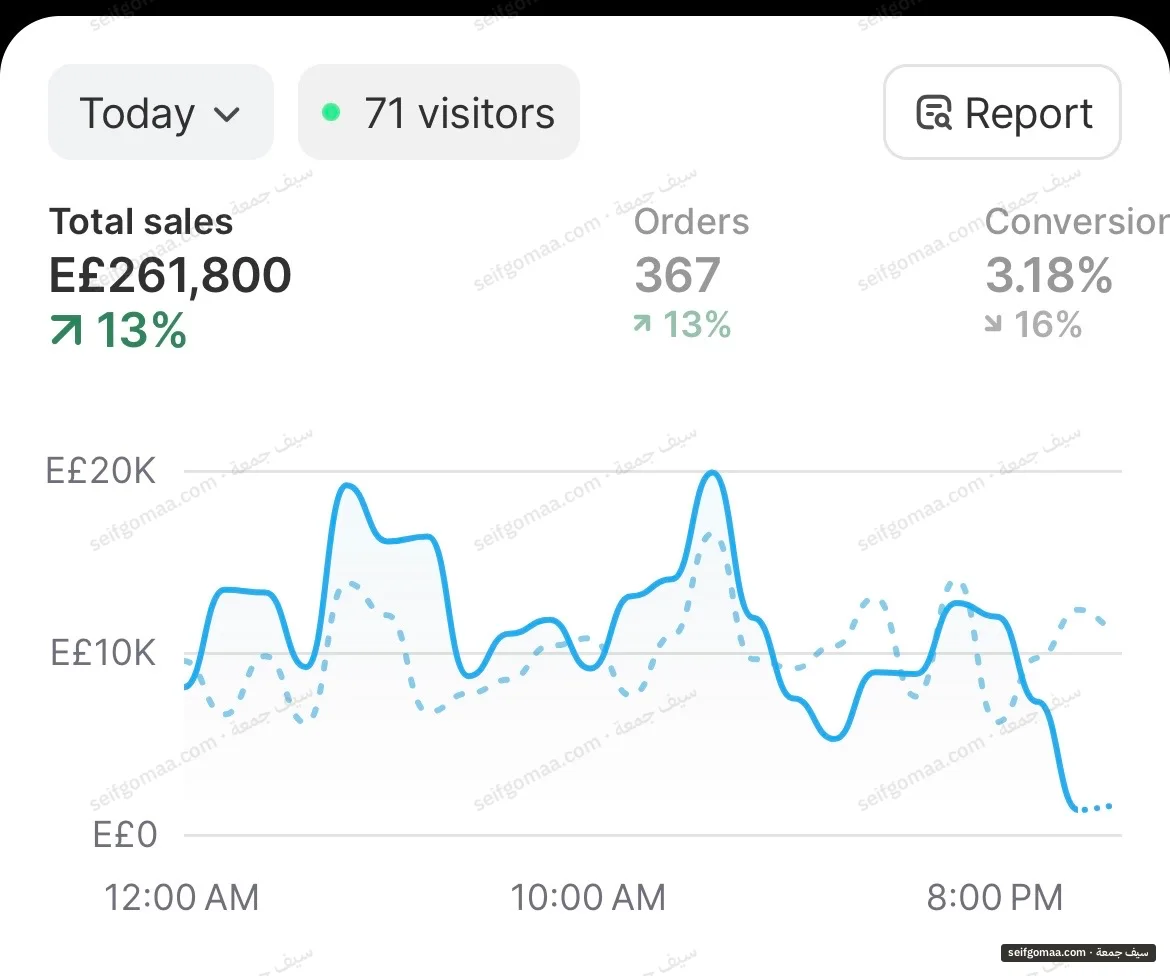
    Shopify Analytics · One day (“yesterday” on the screenshot)
  • Ex. 8One day, as shown · Shopify Analytics · Egypt

    Exhibit 8

    Shopify Analytics
    Shopify Analytics screenshot, One day, as shown, showing sales, orders on an account run by Seif Gomaa. Brand names cropped.

    Shopify Analytics for an account in Egypt, One day, as shown. It shows sales, orders. The figures are in the screenshot only.
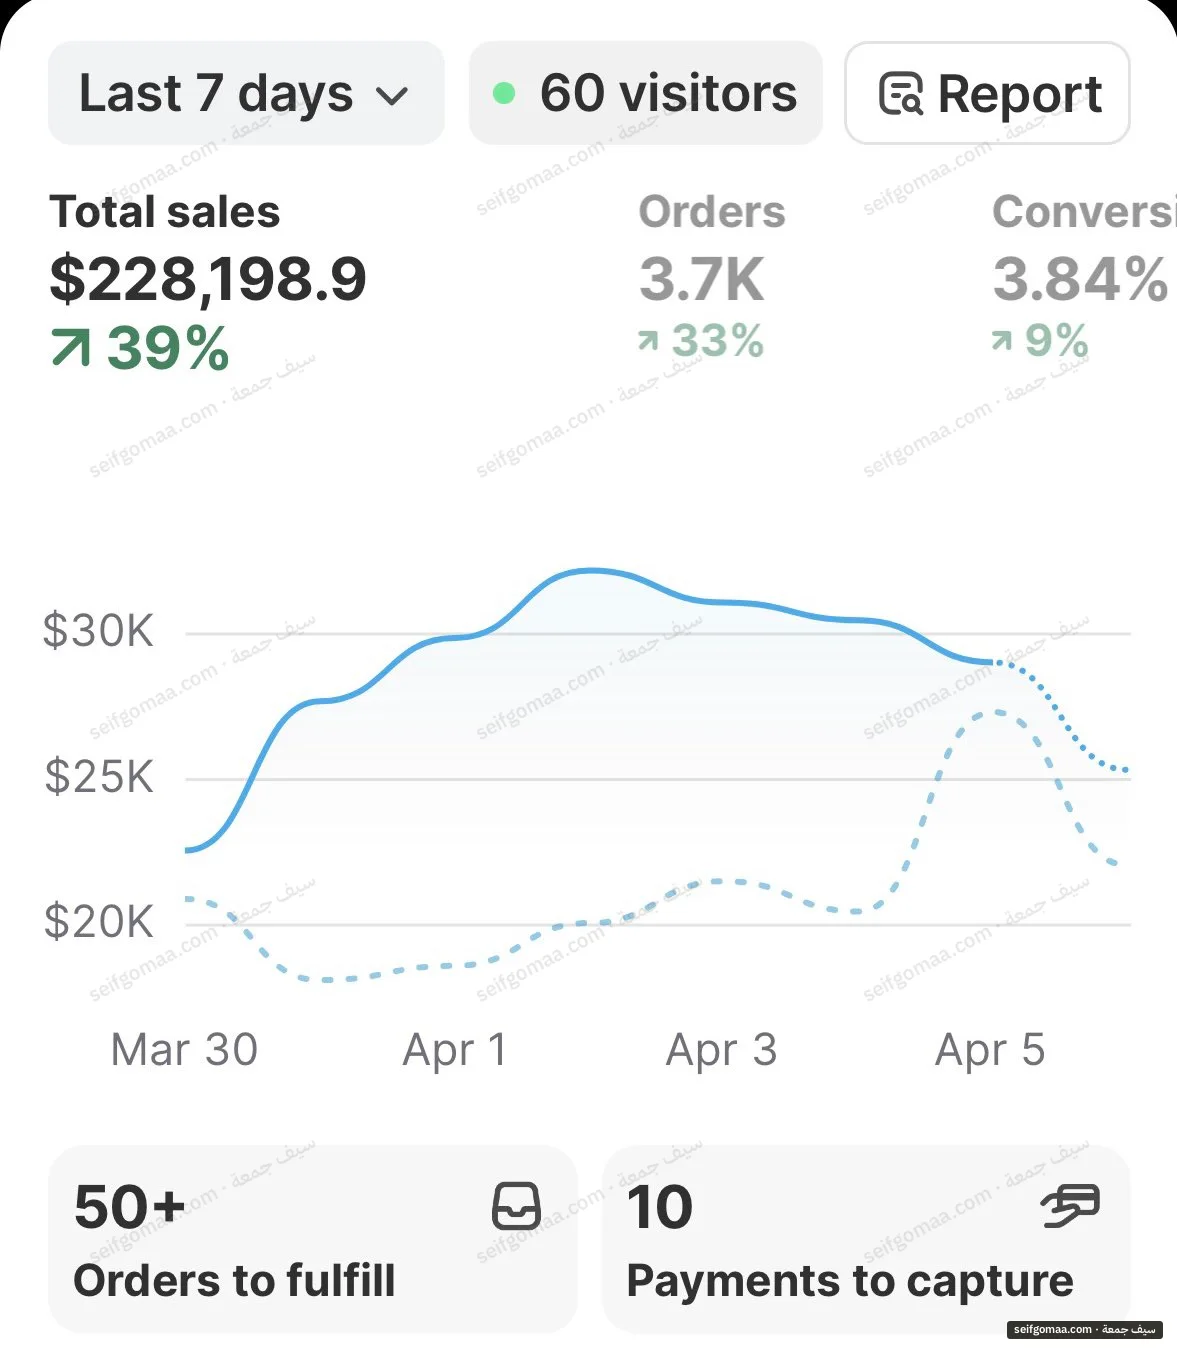
    Shopify Analytics · One day, as shown
  • Ex. 77 days, as shown · Shopify Analytics

    Exhibit 7

    Shopify Analytics
    Shopify Analytics screenshot, 7 days, as shown, showing sales, orders, period change on an account run by Seif Gomaa. Brand names cropped.

    Shopify Analytics, 7 days, as shown. It shows sales, orders, period change. The figures are in the screenshot only.
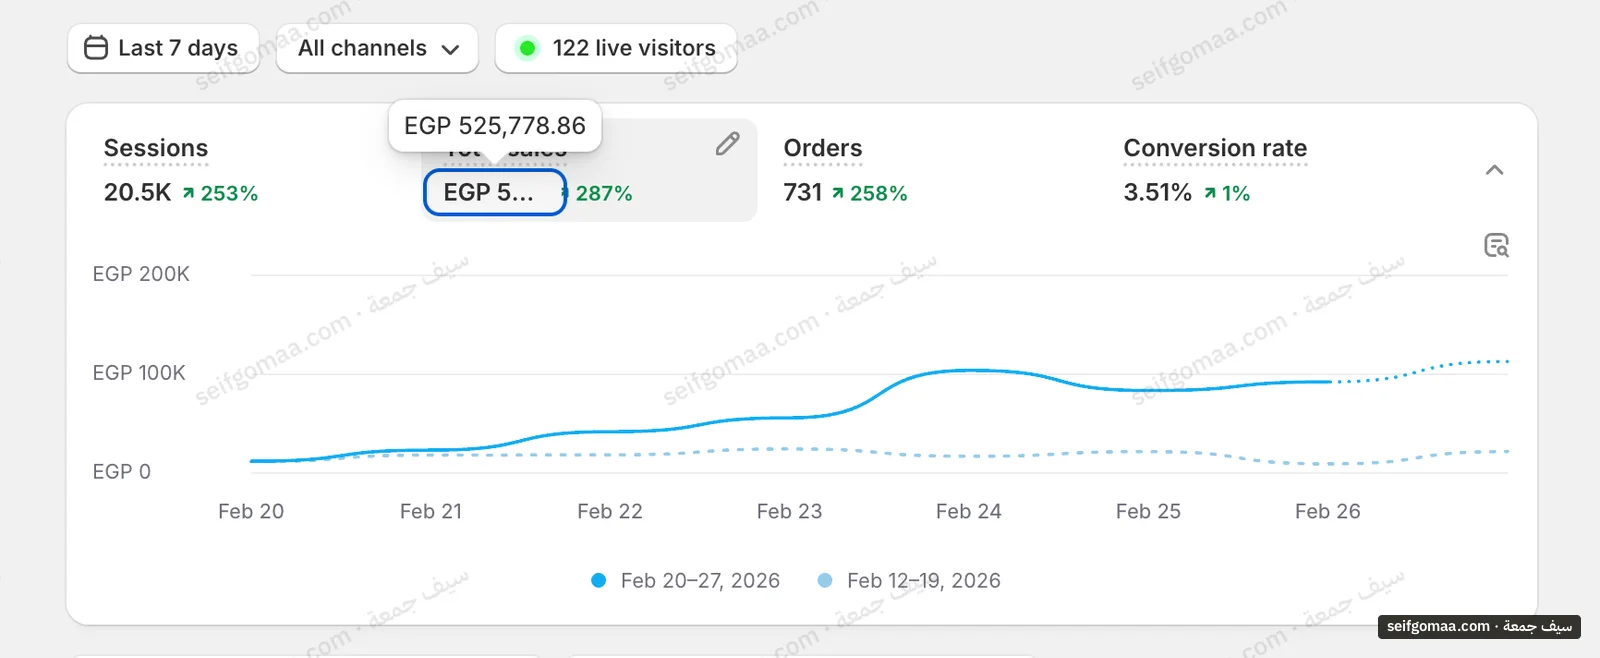
    Shopify Analytics · 7 days, as shown
  • Ex. 67 days in February 2026 · Shopify Analytics · Egypt

    Exhibit 6

    Shopify Analytics
    Shopify Analytics screenshot, 7 days in February 2026, showing sales, period change on an account run by Seif Gomaa. Brand names cropped.

    Shopify Analytics for an account in Egypt, 7 days in February 2026. It shows sales, period change. The figures are in the screenshot only.
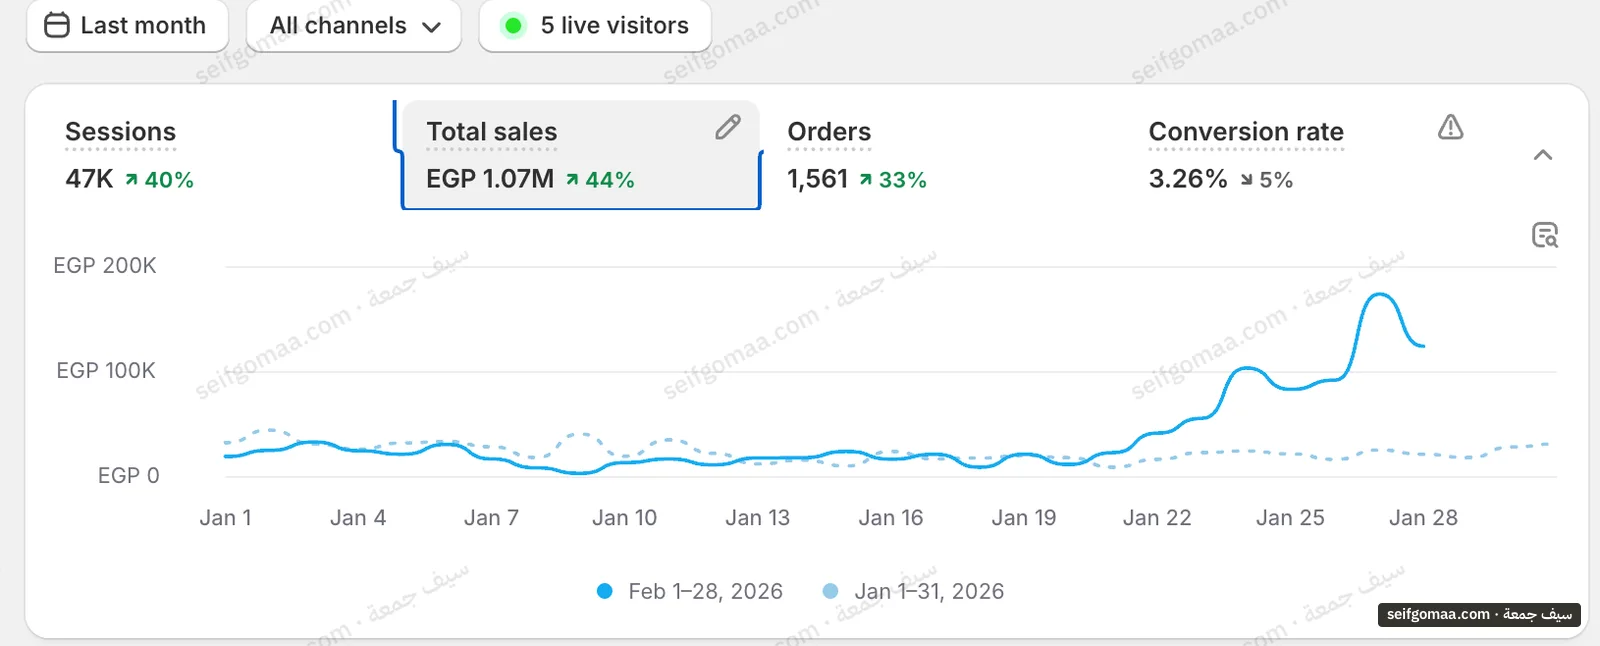
    Shopify Analytics · 7 days in February 2026
  • Ex. 5February 2026 · Shopify Analytics · Egypt

    Exhibit 5

    Shopify Analytics
    Shopify Analytics screenshot, February 2026, showing sales, orders, period change on an account run by Seif Gomaa. Brand names cropped.

    Shopify Analytics for an account in Egypt, February 2026. It shows sales, orders, period change. The figures are in the screenshot only.
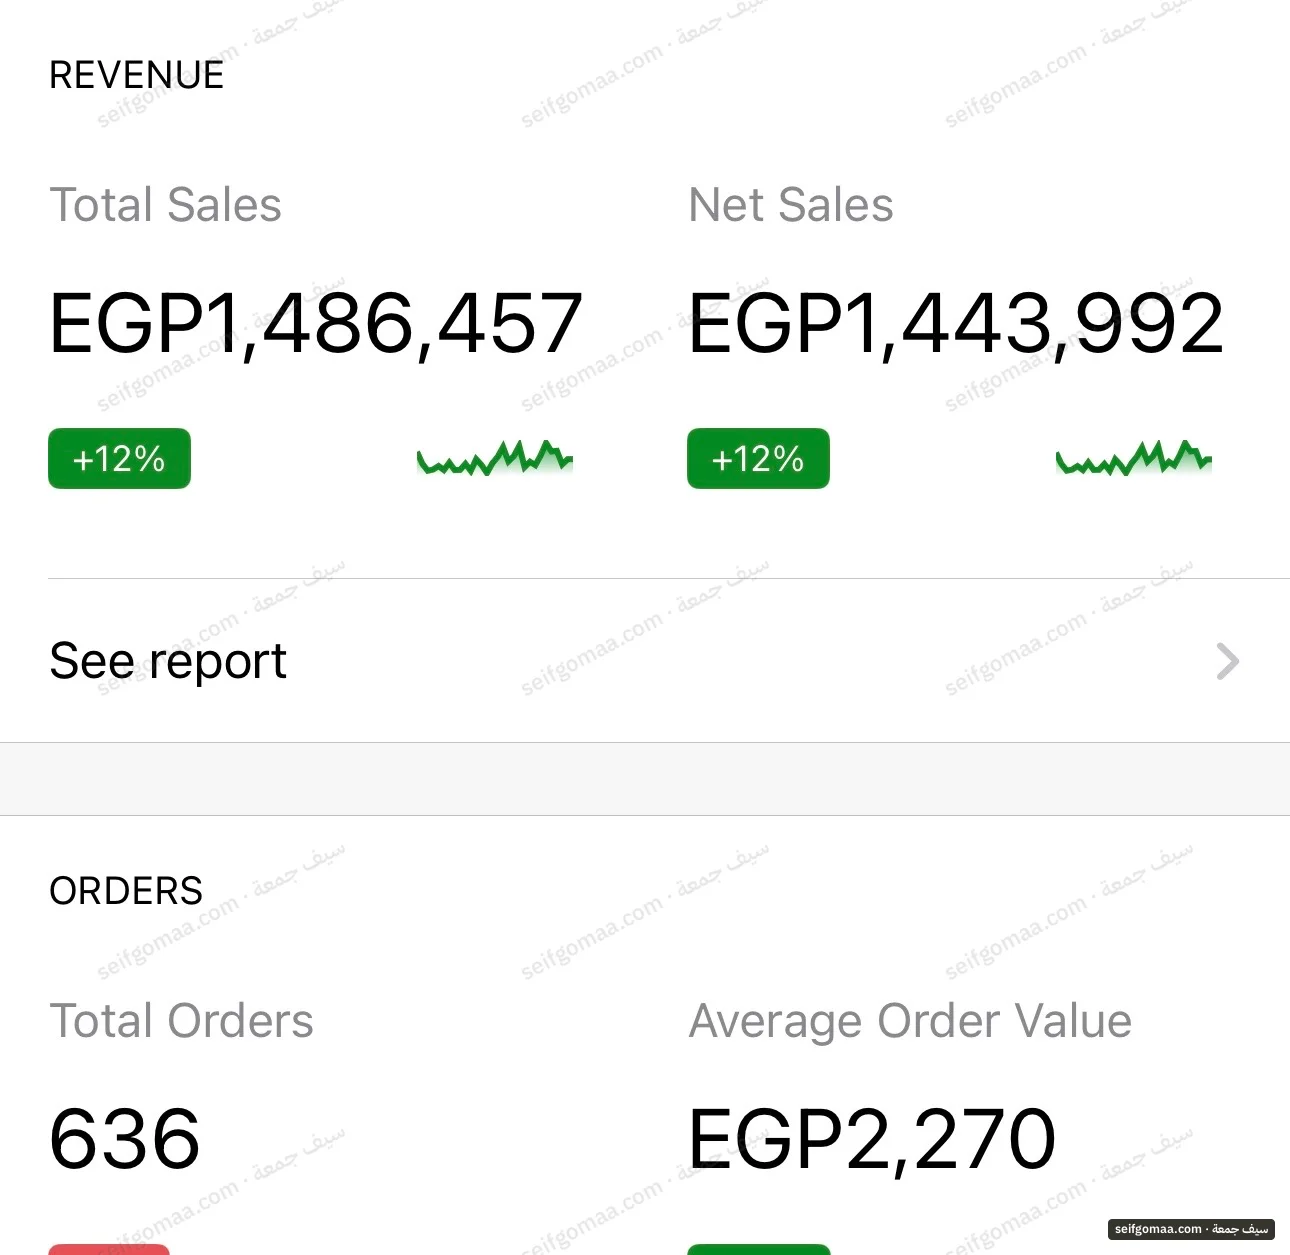
    Shopify Analytics · February 2026
  • Ex. 4Last 30 days, as shown · WooCommerce · Egypt

    Exhibit 4

    WooCommerce
    WooCommerce screenshot, Last 30 days, as shown, showing sales, orders, average order value on an account run by Seif Gomaa. Brand names cropped.

    WooCommerce for an account in Egypt, Last 30 days, as shown. It shows sales, orders, average order value. The figures are in the screenshot only.
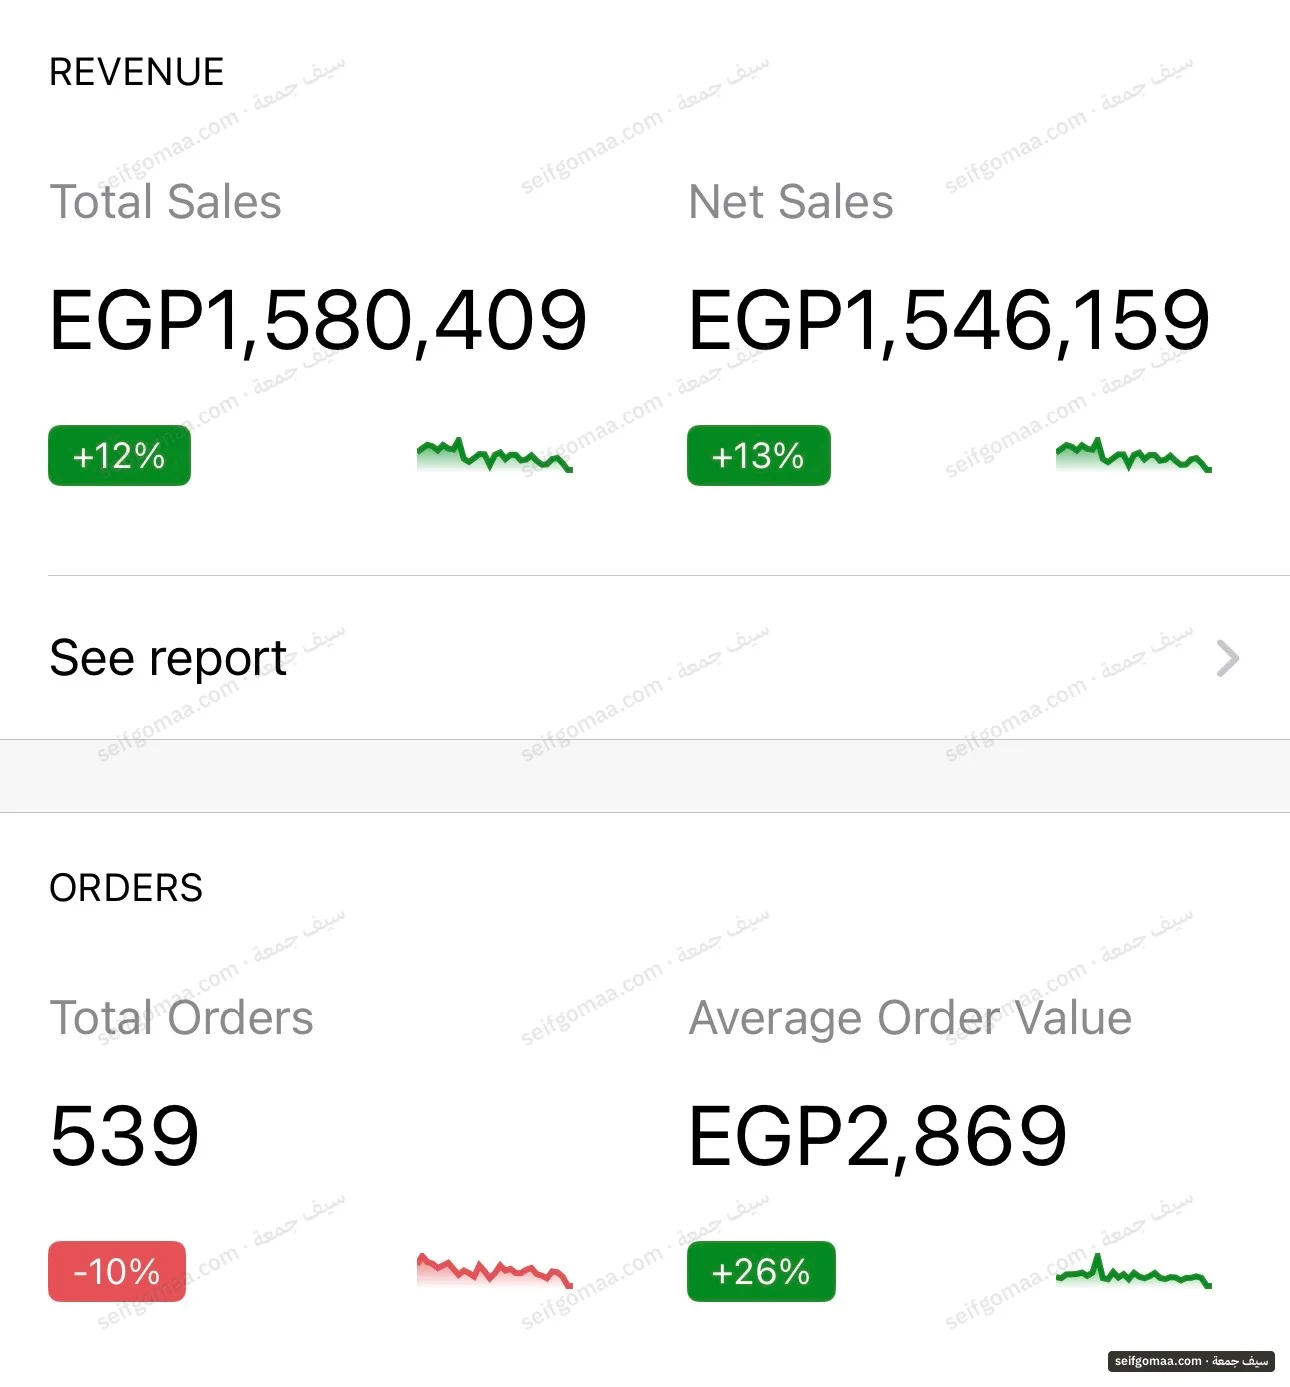
    WooCommerce · Last 30 days, as shown
  • Ex. 3Last 30 days, as shown · WooCommerce · Egypt

    Exhibit 3

    WooCommerce
    WooCommerce screenshot, Last 30 days, as shown, showing sales, orders, average order value on an account run by Seif Gomaa. Brand names cropped.

    WooCommerce back end of a premium retail brand in Egypt, over the last 30 days as the screenshot states them. It shows sales, orders and average order value. This is the raw screenshot behind the premium order-value case study, where targeting was rebuilt around purchase intent and creative stopped leading with the price.
  • Ex. 2March 2026 · Shopify Analytics · Egypt

    Exhibit 2

    Shopify Analytics
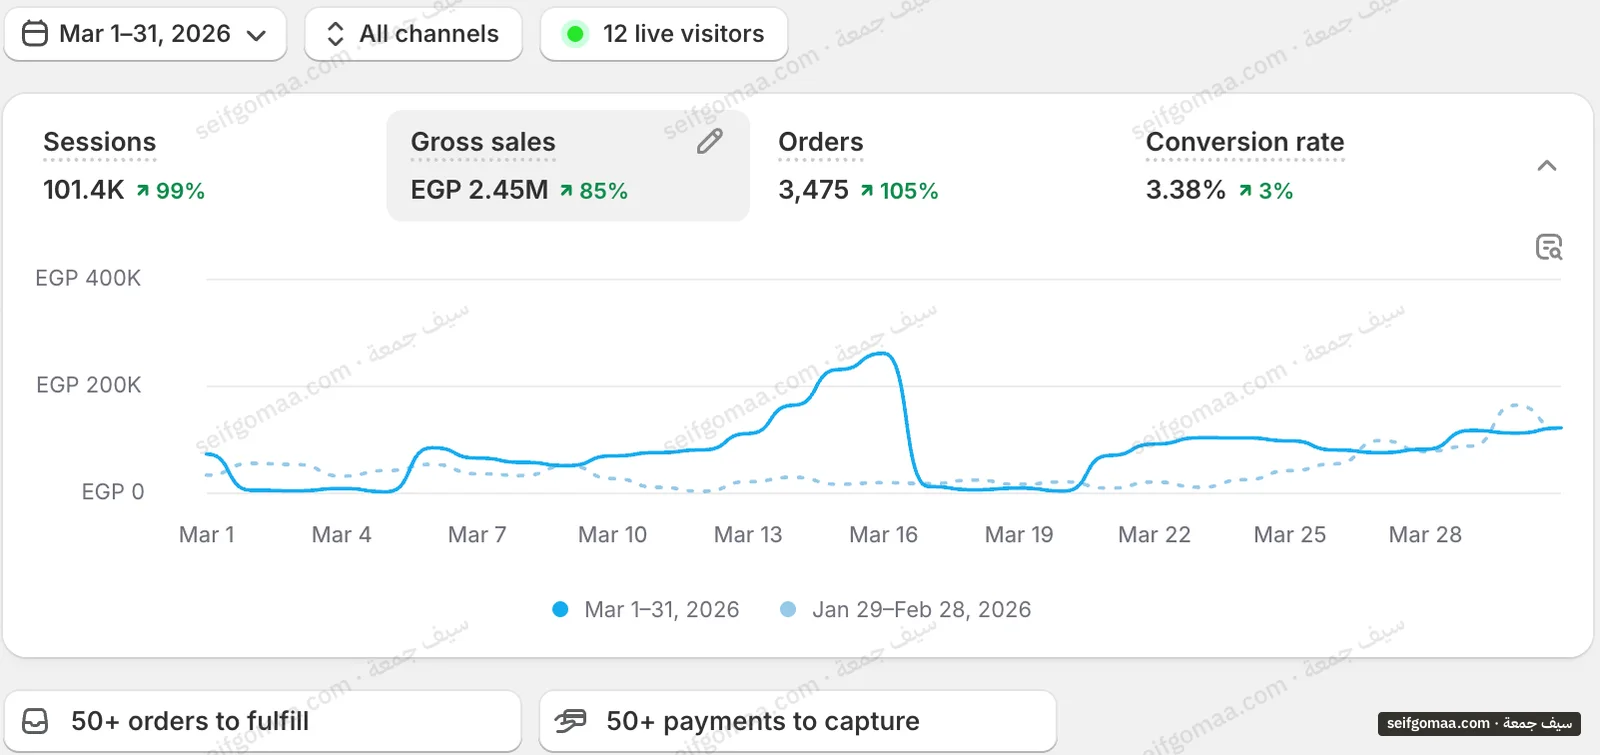
    Shopify Analytics screenshot, March 2026, showing sales, orders, period change on an account run by Seif Gomaa. Brand names cropped.

    Shopify Analytics for an established store in Egypt, March 2026. It shows sales, orders and the change against February. This is the raw screenshot behind the +85% month-over-month case study, where the campaign structure was rebuilt and budget stepped up 20 to 30 percent a week.
  • Ex. 1First month after launch · WooCommerce · Egypt

    Exhibit 1

    WooCommerce
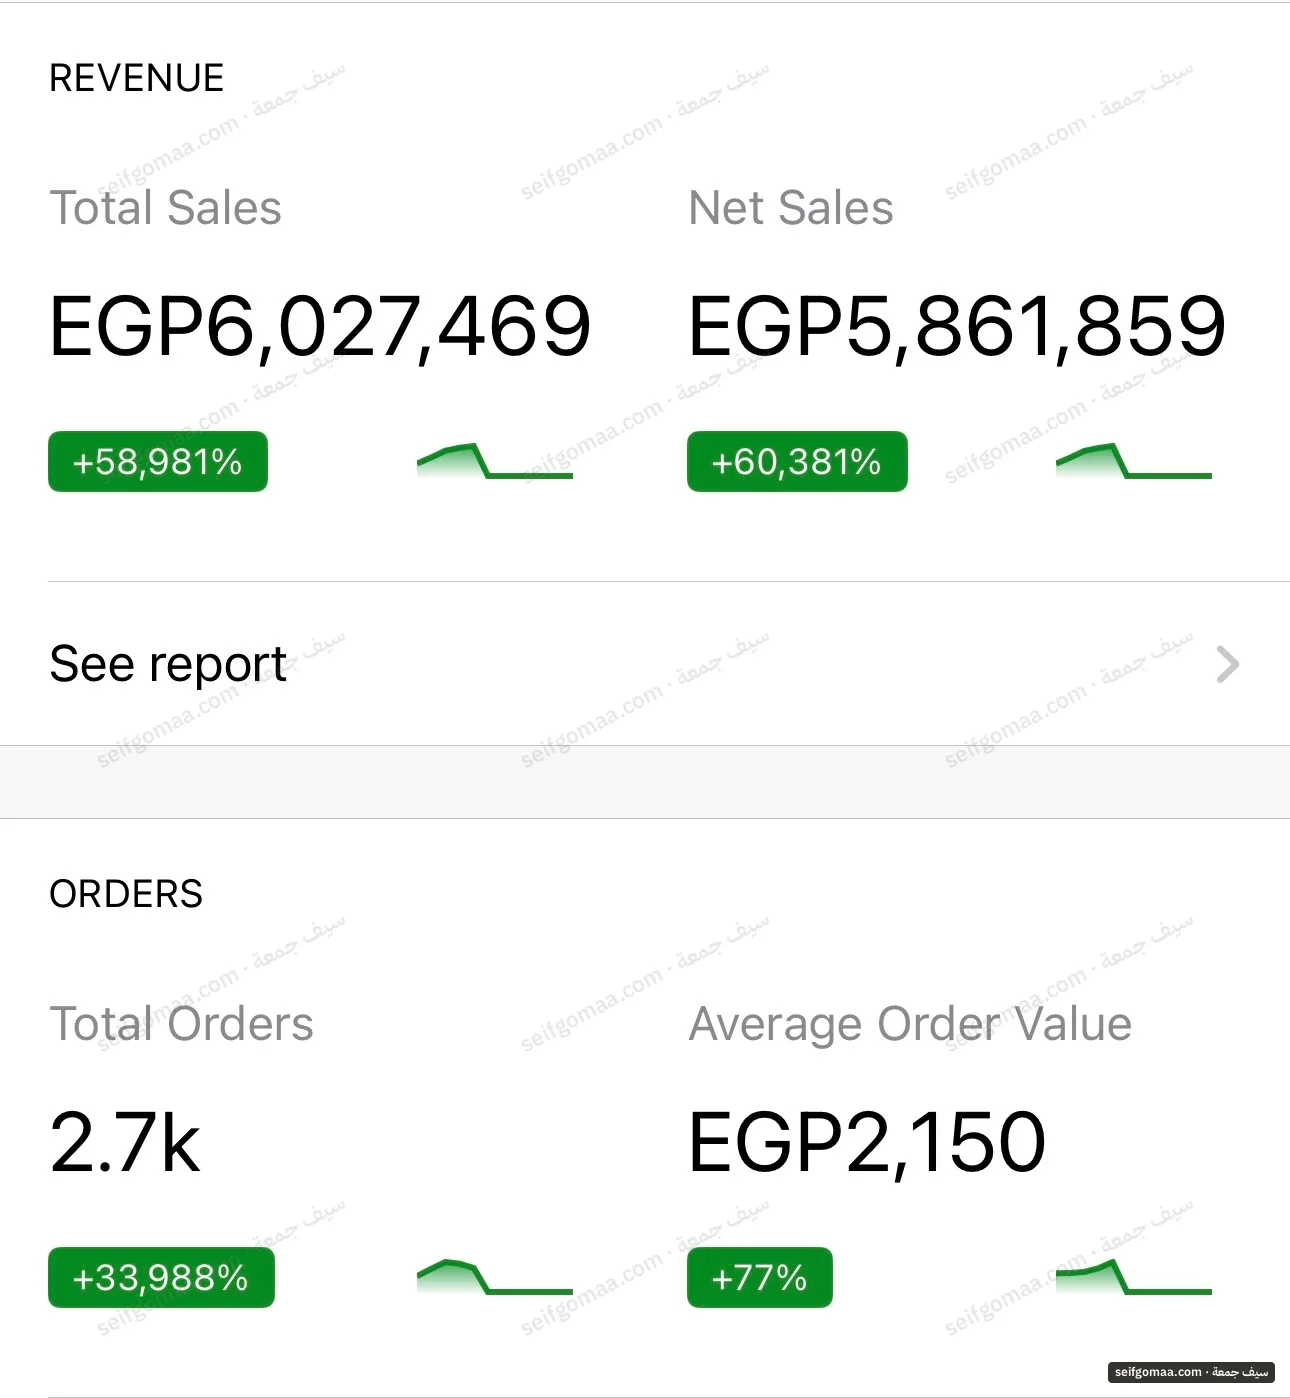
    WooCommerce screenshot, First month after launch, showing sales, orders on an account run by Seif Gomaa. Brand names cropped.

    WooCommerce back end of a new cash-on-delivery brand in Egypt, covering its first month after launch. It shows sales and orders for that month. This is the raw screenshot behind the cold-launch case study, which explains how tracking and a 3×3 creative sprint were set up before budget scaled.

How these numbers are counted.

The screenshots show each number the way the platform reports it: Shopify counts an order when it is placed, and Meta counts a purchase inside its attribution window. On cash on delivery both are before cancellations and refusals at the door, and the figure after delivery is the one the work is judged on.

The spend figure at the top of the homepage has three parts. Meta spend was last read from the Marketing API on 16 October 2026 and is counted forward at the measured daily rate for 21days at most, then it stops. Google, TikTok and Snapchat are declared from account records. The largest part is accounts I ran before or outside today’s API access; that part is declared by me, not read from an API, and I evidence it by hand when a client asks.

Tell me about the store.

WhatsApp is fastest. If you would rather not start a chat yet, leave a number and a link and I will message you within 24 hours.

Message me on WhatsApp

Usually answered the same day, Cairo time.

saifgomaa48@gmail.com

Monthly ad spend, EGP
I reply on WhatsApp within 24 hours. Nothing else is done with your number.